Election Year Update
Mar 25, 2024
 Election season is in full swing as Super Tuesday solidifies another Biden and Trump rematch this November. President Biden won all 15 states and the Iowa caucuses, while former President Trump won in 14 of 15 states, prompting Nikki Haley to end her election bid.
Under the premise the market hates uncertainty, the lack of any surprises into the primaries and little doubt over who will be on the ballot this fall have been among many catalysts driving U.S. equity markets higher this year. Coming into Super Tuesday, the S&P 500 was up over 7% and history suggests this could be a good sign for President Biden’s chance of reelection.
Since 1976, when Super Tuesday first surfaced, market performance ahead of the primaries has correlated closely with election results. While acknowledging the limited data, when the S&P 500 was higher ahead of Super Tuesday, the incumbent president’s political party won the election four of the last five times. And when stocks were lower into Super Tuesday, the incumbent president’s party lost the election six of the last seven times.
S&P 500 and Super Tuesdays (1976–2020)
| Super Tuesday | Incumbent President | S&P 500 YTD Return Into Super Tuesday | Election Winner | Market Prediction Correct? |
| 05/25/1976 | Republican | 10.3% | Democrat | No |
| 03/11/1980 | Democrat | -0.1% | Republican | Yes |
| 03/13/1984 | Republican | -4.9% | Republican | No |
| 03/08/1988 | Republican | 9.0% | Republican | Yes |
| 03/10/1992 | Republican | -2.4% | Democrat | Yes |
| 03/12/1996 | Democrat | 3.4% | Democrat | Yes |
| 03/07/2000 | Democrat | -7.7% | Republican | Yes |
| 03/02/2004 | Republican | 3.3% | Republican | Yes |
| 02/05/2008 | Republican | -9.0% | Democrat | Yes |
| 03/06/2012 | Democrat | 6.8% | Democrat | Yes |
| 03/01/2016 | Democrat | -3.2% | Republican | Yes |
| 03/03/2020 | Republican | -7.0% | Democrat | Yes |
Source: LPL Research, Bloomberg 03/07/24
Disclosures: All indexes are unmanaged and cannot be invested in directly. Past performance is no guarantee of future results.
Looking Ahead
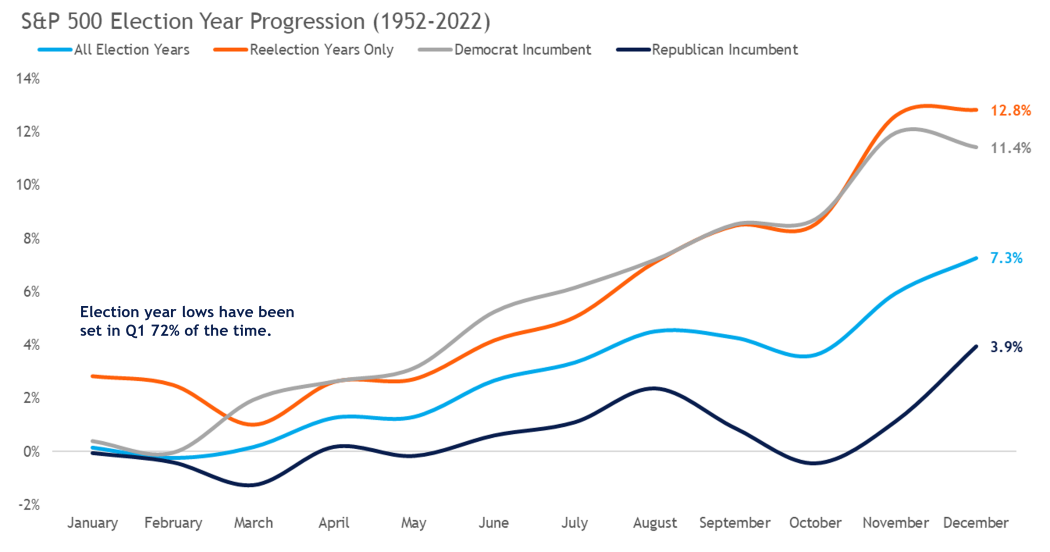
With Super Tuesday in the rearview mirror, the market is now looking ahead to election night with a bit more clarity. Perhaps unsurprisingly, seasonal strength for stocks also tends to pick up after Super Tuesday. Since 1952, election-year lows have been set during the first quarter 72% of the time, with March having the highest frequency. In terms of annual election-year returns, the S&P 500 has generated an average price return of 7.3% (excluding dividends) during all election years since 1952. However, when election years are positive, as they tend to be (83% of the time), the average price return jumps to 12.2%. Also, during a reelection year such as this year, or with a Democrat incumbent president, the S&P 500 has posted average annual price returns of 12.8% and 11.4%, respectively.
Election Year Seasonality Heats Up

Source: LPL Research, Bloomberg 03/07/24
Disclosures: Past performance is no guarantee of future results. All indexes are unmanaged and can’t be invested in directly. The modern design of the S&P 500 stock index was first launched in 1957. Performance back to 1950 incorporates the performance of the predecessor index, the S&P 90.
Who Does the Market Want to Win?
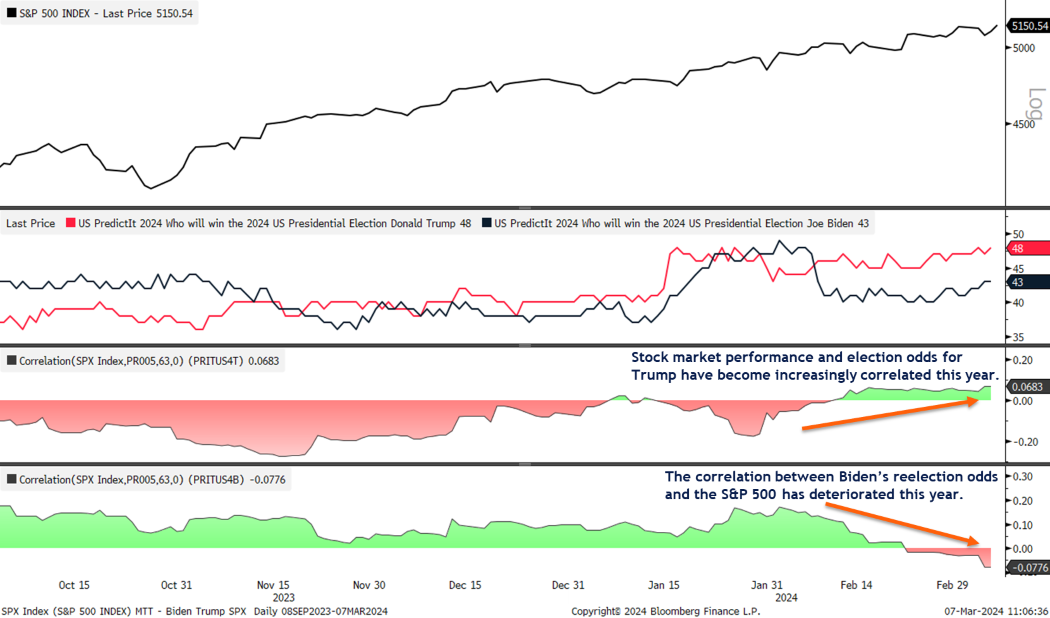
Rather than speculate on how each nominee’s potential policies may or may not impact the equity market, we examined how the market has reacted to the changes in each candidate’s probability of winning the election. More specifically, we analyzed the correlation between the daily percent change of the S&P 500 and the daily percent change of President Biden and former President Trump’s probabilities of winning the election, based on odds from predictit.org.
In short, the market appears to be welcoming the higher probability of a Trump victory, evidenced by a rising correlation between his chances of winning the election and the S&P 500 over the last few months. In contrast, President Biden’s predictit.org odds have slid lower since the start of the year, and as a result, are negatively correlated to S&P 500 performance.
Election Odds & Market Performance

Source: LPL Research, Bloomberg. PredictIt.org 03/07/24
Disclosures: Past performance is no guarantee of future results.
Summary
Stocks are off to an impressive start this election year, and seasonal trends suggest the momentum could continue. While LPL Research expects some pullbacks along the way, political clarity into the November election leaves the market with one less thing to worry about. Signals from the market over the potential election winner have been mixed. The positive performance into Super Tuesday points to a potential Biden victory. However, recent equity market performance has become increasingly correlated with the odds of an election victory for former President Trump.
IMPORTANT DISCLOSURES
This material is for general information only and is not intended to provide specific advice or recommendations for any individual. There is no assurance that the views or strategies discussed are suitable for all investors. To determine which investment(s) may be appropriate for you, please consult your financial professional prior to investing.

Investing involves risks including possible loss of principal. No investment strategy or risk management technique can guarantee return or eliminate risk.

Indexes are unmanaged and cannot be invested into directly. Index performance is not indicative of the performance of any investment and does not reflect fees, expenses, or sales charges. All performance referenced is historical and is no guarantee of future results.

This material was prepared by LPL Financial, LLC. All information is believed to be from reliable sources; however LPL Financial makes no representation as to its completeness or accuracy.

Unless otherwise stated LPL Financial and the third party persons and firms mentioned are not affiliates of each other and make no representation with respect to each other. Any company names noted herein are for educational purposes only and not an indication of trading intent or a solicitation of their products or services.

Asset Class Disclosures –

International investing involves special risks such as currency fluctuation and political instability and may not be suitable for all investors. These risks are often heightened for investments in emerging markets.

Bonds are subject to market and interest rate risk if sold prior to maturity.

Municipal bonds are subject and market and interest rate risk and potentially capital gains tax if sold prior to maturity. Interest income may be subject to the alternative minimum tax. Municipal bonds are federally tax-free but other state and local taxes may apply.

Preferred stock dividends are paid at the discretion of the issuing company. Preferred stocks are subject to interest rate and credit risk. They may be subject to a call features.

Alternative investments may not be suitable for all investors and involve special risks such as leveraging the investment, potential adverse market forces, regulatory changes and potentially illiquidity. The strategies employed in the management of alternative investments may accelerate the velocity of potential losses.

Mortgage backed securities are subject to credit, default, prepayment, extension, market and interest rate risk.

High yield/junk bonds (grade BB or below) are below investment grade securities, and are subject to higher interest rate, credit, and liquidity risks than those graded BBB and above. They generally should be part of a diversified portfolio for sophisticated investors.

Precious metal investing involves greater fluctuation and potential for losses.

The fast price swings of commodities will result in significant volatility in an investor's holdings.

Securities and advisory services offered through LPL Financial, a registered investment advisor and broker-dealer. Member FINRA/SIPC.

Not Insured by FDIC/NCUA or Any Other Government Agency | Not Bank/Credit Union Deposits or Obligations | Not Bank/Credit Union Guaranteed | May Lose Value

These views do not necessarily reflect the views and opinions of Epic Capital pertaining to the election and is merely an article surrounding the statistics of presidential elections.
More Insights
Few terms in personal finance are as important, or used as frequently, as “risk.” Nevertheless, few terms are as imprecisely defined. Generally, when financial advisors or the media talk about investment risk, their focus is on the historical price volatility of the asset or investment under discussion.
As Americans get their grills and beach chairs ready for the July 4th holiday, the stock market and the weather across much of the country have both been on heaters. Stocks and bonds continue to effectively navigate a complex policy landscape shaped by evolving trade dynamics, geopolitical tensions, and fiscal stimulus. The market’s resilience in … Continue reading “Market Update – America Gets Record High Stock Prices for Its Birthday”
Birthdays may seem less important as you grow older. They may not offer the impact of watershed moments such as getting a driver’s license at 16 and voting at 18. But beginning at age 50, there are several key birthdays that can affect your tax situation, health-care eligibility, and retirement benefits.
During times like these when geopolitical headlines can be unsettling for investors, we at LPL Research like to remind ourselves of one of our key investing principles. Markets have always faced challenges —ranging from geopolitical conflicts and economic downturns to natural disasters, political upheaval and health crises. These events often trigger short-term volatility and shake … Continue reading “Why Long Term Investing Beats Selling in Volatile Times”
Are you concerned about the inheritance taxes your heirs may have to pay? Then you may want to consider creating charitable lead trusts.
Services
Epic Capital provides the following comprehensive financial planning and investment management services: Learn More >


 Top of Page


